


How to Read a Diamond Grading Report
One of the biggest challenges that diamond buyers face is trying to decipher all of the information provided on the various diamond grading reports used throughout the industry to document the characteristics of the diamonds being offered for sale.
The format for the Proprietary Light Performance Diamond Quality Document (DQD) which is issued by the American Gem Society Laboratory (AGSL) for all of the diamonds featured in the Brian Gavin Signature and Brian Gavin Blue collections, is fairly straightforward even though it is extremely detailed.
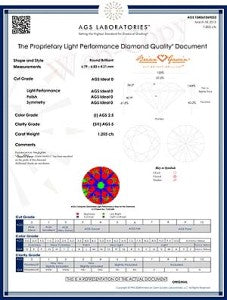 The DQD pictured to the left is an example of the Proprietary Light Performance diamond grading report issued by the AGSL for one of our Signature Round Brilliant Cut Diamonds. The left column of the report provides the measurements for the diamond, and indicates that the overall cut grade is AGS Ideal-0, which is the highest cut grade available. It also indicates the clarity grade of the diamond, the color grade, fluorescence rating, and carat weight which is expressed to the third decimal point. And there is a comments section which references the presence of our inscription and any notes. The right column contains a proportions diagram which is drawn to scale based upon the measurements of the diamond, and a plotting diagram which acts as a map of the clarity characteristics located within the diamond.
Understanding the Overall Cut Grade of a Diamond:
The overall cut grade of a diamond graded by the American Gem Society Laboratory (AGSL) is based upon individual grades for Polish, Symmetry, Proportions, and Light Performance. The AGSL is the only laboratory in the world which uses proprietary Angular Spectrum Evaluation Technology to determine the brightness of the diamonds which they grade.
The overall cut grade defaults to the lowest denominator of the factors polish, symmetry, proportions, and light performance. In order for the overall cut grade to be AGS Ideal-0 the individual grade for all four factors must be AGS Ideal-0. If the individual grade for any of the four factors is lower than AGS Ideal-0, then the overall cut grade of the diamond defaults to the lower grade of that characteristic.
For instance, if a diamond had AGS-2 Very Good Polish, AGS Ideal Symmetry, AGS Ideal Proportions, and AGS Excellent Light Performance, then the overall cut grade of the diamond will drop down to AGS-2 Very Good.
All of the diamonds featured in the Brian Gavin Signature and Brian Gavin Blue collections have an overall cut grade of AGS Ideal-0, which ensures that the diamond which you select will exhibit a superior level of light return and sparkle factor!
Understanding the Proportions Diagram:
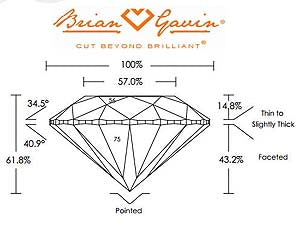 The proportions diagram provided on an AGSL Diamond Quality Document is a scale model of the diamond, based upon the measurements for total depth, table diameter, crown angle, pavilion angle, girdle thickness and culet size. The table diameter is shown here at 57% and the total depth at 61.8% with a crown angle of 34.5° and a pavilion angle of 40.9° with a thin to slightly thick, faceted girdle edge and a pointed culet. The star facet average is indicated as being 56% and the lower halves are 75%.
This represents the middle of the range specified for the zero ideal cut proportions rating under the grading guidelines set forth by the American Gem Society Laboratory and is typical of Brian Gavin Signature and Brian Gavin Blue diamonds.
Diamond Clarity Characteristics:
The inclusions within a diamond are commonly referred to as clarity characteristics and are indicated on the plotting diagram of the diamond grading report to provide people with a reference as to the size, type and location of the primary inclusions which the clarity grade of the diamond is based upon.
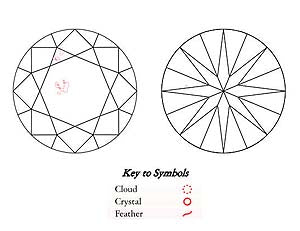 For instance, the plotting diagram which appears to the left, indicates that the SI-1 clarity grade of this diamond is based upon the presence of a few diamond crystals, clouds of pinpoints size diamond crystals and a feather, as indicated by the red marks located within the table facet, and the triangle shaped star facet which is located in the eleven o'clock position of the upper plotting diagram which is pictured on the left, and a feather within the upper girdle facet located in the eleven o'clock position of the lower plotting diagram.
The Purpose of a Plotting Diagram:
The purpose of the plotting diagram featured on most diamond grading reports, such as those issued by the Gemological Institute of America (GIA) and the American Gem Society Laboratory (AGSL) is to provide a visual reference as to the approximate location of the primary inclusions located within the diamond being graded.
Diamond grading professionals and retail jewelers use the information provided on the plotting diagram, combined with other characteristics, such as the dimensions of the diamond, to verify the identity of a diamond for inventory tracking purposes and valuation.
The plotting diagram is similar to a map of the diamond, however it is one dimensional and does not provide an indication as to the location of the inclusions in terms of the depth which they are located within the diamond, nor does it provide any indication as to the color or tonal value of the inclusions.
Thus plotting diagrams are not intended, nor should they be used, to try and determine the extent to which a diamond might be "eye clean" or not, because this is not the intended purpose of a plotting diagram and any assessments made to that effect are likely to be inaccurate.
This is why it is important to work with a detail oriented vendor like Brian Gavin when purchasing diamonds online, because we personally inspect and evaluate every diamond that we represent, provide detailed clarity photographs, three dimensional video, and a variety of reflector scope images, which can assist you with making an informed decision.
Interpreting the ASET Picture:
The round image located in the middle of the Diamond Quality Document which is pictured in red, green, and blue, is the results of the proprietary Angular Spectrum Evaluation Technology (ASET) which the American Gem Society Laboratory uses to measure the brightness of the diamond and determine how it is making use of the light which is available to it.
