

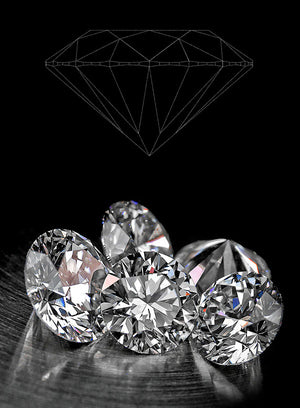


Compare diamond pictures of ideal vs super ideal cuts
“I’ve read a lot of testimonials and blog posts about how great looking Brian Gavin Signature diamonds are supposed to be, but I’m not certain that I’d be able to tell the difference between an ideal and a super ideal cut diamond. It seems like the people who purchased ideal cut diamonds write posts that support and justify their buying decision, while people who bought super ideal cut diamonds are doing the same thing. What I’d like to see is something that enables me to compare diamond pictures of ideal vs super ideal cut diamonds, which helps me understand the differences that I’m supposed to be able to see.”
Visible differences between ideal vs super ideal diamonds:
One of the challenges people face when buying a diamond online is that they are not able to fully appreciate the subtle differences created by varying degrees of optical precision. We supply a full array of reflector scope images to quantify the exceptional optical precision exhibited by our diamonds, but it’s difficult to appreciate until you actually lay eyes upon the diamond.
Trying to ascertain the differences between standard ideal and super ideal cut diamonds based solely upon the information contained in the lab reports is like trying to appreciate the differences presented by fine wine, without actually being able to taste the wine, but rather only being able to read a review written by the vintner. Wine descriptions commonly contain references to acidity, tannin and fruit level, but can you truly appreciate that without tasting the wine?
Likewise, you can’t really appreciate the sparkle factor of different levels of ideal cut diamonds, without the additional insight provided by the reflector scope images.
Using ASET to compare ideal vs super ideal cut diamonds:
 The AGS Laboratory developed Angular Spectrum Evaluation Technology (ASET) for the purposes of grading the Light Performance of diamonds. This ASET image is provided in the diamond details page for a GIA Excellent cut round diamond that has a total depth of 61.8% and a table diameter of 57% with a pavilion angle of 40.8 degrees, which is offset by a crown angle of 34.5 degrees. The proportions of the diamond are in the middle of the spectrum designated for the AGS zero ideal cut rating, the overall cut grade of the diamond is GIA Excellent. But this ASET image shows extensive light leakage under the table facet, as indicated by the green arrows.
From our perspective, this diamond is a perfect example of one of the primary differences between standard ideal and super ideal cut diamonds. The proportions of this diamond are spot-on, right in the middle of the spectrum, but the optical precision of the diamond does not meet our standards for the super ideal cut classification.
 Compare the ASET image above with the ASET image for this 1.316 carat, E-color, VS-1 clarity, Brian Gavin Signature round diamond. Notice how consistent the distribution of red, green, and blue is throughout this super ideal cut diamond. There are no signs of light leakage under the table facet, there is a lot of red, which indicates the highest level of brightness. Both diamonds were photographed on a white background. Both diamonds are the same relative carat weight, and both diamonds have proportions in the middle of the spectrum for the zero ideal cut proportions rating. The difference between the diamonds is the degree of optical precision.
Visible differences between ideal and super ideal diamonds:
 Knowing that the super ideal cut diamond is going to outperform the sparkle factor of a standard ideal cut diamond is just common sense. It doesn’t take a rocket scientist to figure out that the ideal cut diamond with the better ASET image is going to reflect more light and deliver better sparkle. Just look at how much light is actually leaking out the table facet of that other ideal cut diamond. What percentage of light would you estimate is being lost in that image? Do you think the variations in the degree of optical precision indicated by the green arrows in this hearts image of that diamond have anything to do with it? You’d be correct if you said yes.
 Notice how the hearts exhibited by this 1.316 carat, E-color, VS-1 clarity, Brian Gavin Signature round diamond are so much more even and precise. Do you think that the higher degree of optical precision exhibited by this diamond has anything to do with the higher degree of visual performance? Once again, you’d be correct if you said yes. It isn’t difficult to imagine how much brighter and vivid looking the super ideal cut diamond is going to be. This is why we provide reflector scope images for every Brian Gavin Signature diamond. When you compare pictures of ideal and super ideal cut diamonds, the differences in visual performance become crystal clear.
